Basetime: Precision Geodetic Solutions - Unlocking Excellence in geodetic data and tunnel construction.
The Automated Measurements of Settlement Rods
One of our first applications is the automated measurement of settlement rods. Geotechnical departments must gain insights into the settlement of the original ground level, and the compaction of the additional material applied. To obtain this information, the placed settlement rods must be monitored periodically.

One of our first applications is the automated measurement of settlement rods. Geotechnical departments must gain insights into the settlement of the original ground level, and the compaction of the additional material applied. To obtain this information, the placed settlement rods must be monitored periodically. Traditionally, this task was carried out by surveyors. We however, will use Locator one devices to monitor and present both the vertical movement of the original ground level and the thickness of the newly applied sand package.

The height determination of the settlement rod, and thus the height of the base plate that is placed on the ground level, will be measured by the GNSS sensor in Locator one. The sand package however, cannot be measured directly by the GNSS sensor. As a result we use the radars rangefinder,  through which we can determine the distance between the bottom of the Locator one and the surface of the sand package.
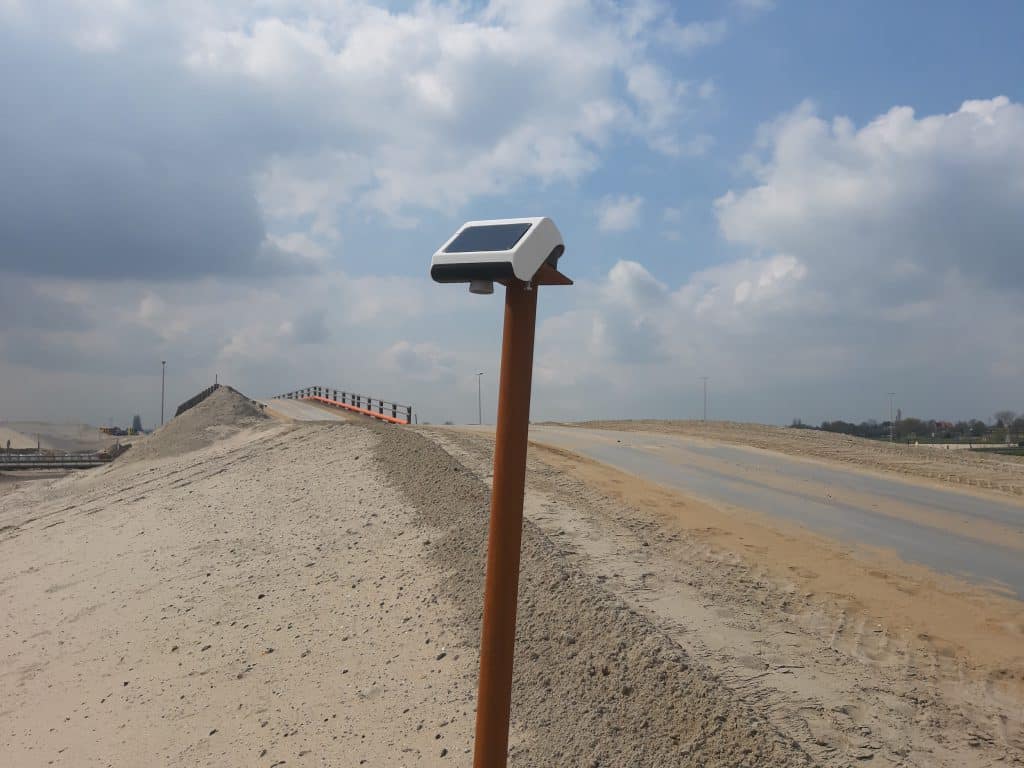
By calculating this distance with an offset to the height observation of the GNSS antenna, we can obtain the absolute height or a thickness determination of the sand package. The requested information is then made accessible to you through the Basetime dashboard or can be sent to your own management application via an API.

The elevation component (Z direction) is the primary need of the geotechnical specialist. However, the movements in the horizontal plane (XY values) can also provide a wealth of information to the user. In addition to a 2D position determination for the location registration of a settlement rod on a geographic map and database, the XY observations can provide insights on disturbances a settlement rod might incur due to, for example, collisions with heavy machinery. In case of such an event you will receive an automatic notifications on either your phone or e-mail.

Read more?

What’s new in Parvamoti? Part 3 of 3: View Movement Parallel and Perpendicular to Your Asset

For Object Monitoring projects, movement can now be viewed in relation to the actual direction of the asset.

By defining the Angle Linear Asset, Parvamoti can visualise displacement parallel and perpendicular to the structure, making it easier to understand whether movement is occurring along or across bridges, railways, roads and other linear assets.

A clearer way to interpret movement. More context for your monitoring data.

Lees meer

Part 3 of 3: View Movement Parallel and Perpendicular to Your Asset

INTERGEO 2026 recap: three days of monitoring in Munich

INTERGEO 2026 is a wrap!
We had three great days in Munich, meeting people from across the geospatial and monitoring industry and talking about projects, monitoring challenges and the possibilities of automated GNSS monitoring.

A big thank you to everyone who stopped by the Basetime booth.

Lees meer

barry, erik, martijn, koen en luna op intergeo 2026 in munchen

Introducing Alerts in Parvamoti

Monitoring shouldn’t mean continuously checking a dashboard to see whether something has changed.

With Alerts in Parvamoti, users can define relevant movement conditions and automatically notify the right people by email, SMS or both when those conditions are met.

That means less time spent manually checking monitoring dashboards, greater oversight of changing conditions and more focus on what happens next.

With the latest Alerts V2 update, we’ve expanded this functionality with more precise device targeting, new movement comparison options, clearer threshold guidance and a simpler configuration flow.

It’s another step towards our goal of making Parvamoti a more proactive monitoring platform, moving from reliable monitoring data towards timely information and action.

In our latest newsletter, we introduce Alerts in Parvamoti and take a closer look at what the new functionality offers.

Lees meer

alerts in parvamoti

What’s new in Parvamoti? – Part 2 of 3: Understand settlement relative to your project baseline

In the second part of our Parvamoti update series, we’re highlighting the 𝗥𝗲𝗹𝗮𝘁𝗶𝘃𝗲 𝗦𝗲𝘁𝘁𝗹𝗲𝗺𝗲𝗻𝘁 𝘃𝗶𝗲𝘄 𝘄𝗶𝘁𝗵𝗶𝗻 𝘁𝗵𝗲 𝗦𝗲𝘁𝘁𝗹𝗲𝗺𝗲𝗻𝘁 𝗥𝗼𝗱 𝗱𝗮𝘀𝗵𝗯𝗼𝗮𝗿𝗱.

This allows users to analyse soil level and ground plate height relative to the initial project baseline, making it easier to follow settlement development and recognise movement trends over time.

The dashboard also brings these measurements together visually, with the option to review individual measurements, averaged values and export the data for further analysis.

Read Part 2 to learn more about how Relative Settlement provides clearer context for settlement monitoring.

Lees meer