

Parvamoti is Basetime’s monitoring platform, where measurement data from monitoring projects can be viewed, analysed and interpreted through dedicated dashboards.
One of the latest additions to Parvamoti gives Settlement Rod users another way to understand how their project is developing over time.
Introducing Relative Settlement
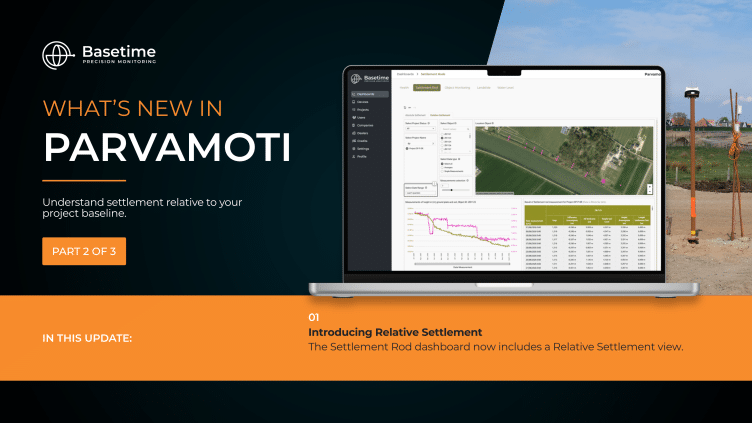
The Settlement Rod dashboard now includes a Relative Settlement view.
Alongside absolute measurements, users can view soil level and ground plate height relative to the initial project baseline. This makes it easier to understand how settlement develops over time and identify movement trends without having to interpret absolute elevation values alone.

What are you seeing in the image?
The Relative Settlement graph brings the key measurements together in one view:
- The green line represents the settlement of the ground plate height.
- The pink line represents the soil level thickness.
- When Averages or Select all is selected, dashed lines show averaged values based on the selected measurement settings.
This gives users the flexibility to review individual measurements in detail or use averaged values to see broader settlement trends more clearly.
The map also uses a satellite background to provide additional location context.
Measurement results are available in table format and can be exported to Excel for further analysis.
Together, these views make it easier to follow how the monitored ground and settlement rod are changing relative to the point where the project started.
Settlement with more context
By presenting measurements relative to the project baseline, the new view provides another way to recognise settlement trends and understand change over the course of a project.
Already using Parvamoti? Log in and explore the Relative Settlement view.
Want to learn more about Parvamoti? Visit our website to discover more here, or contact a member of our team here to discuss how Parvamoti could support your monitoring projects.


