

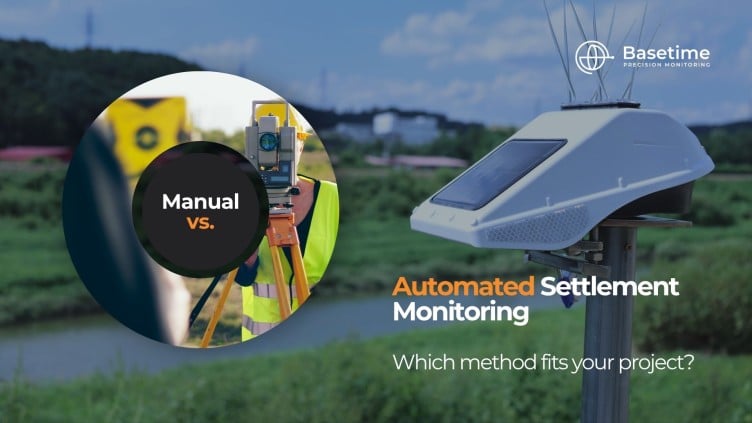
Settlement monitoring is not only about measuring how far the ground has moved.
Project teams also need to know:
- Is the ground behaving as expected?
- Is settlement slowing down?
- How did the site respond after the latest fill layer?
- Does a monitoring point require attention?
- When can the next project phase be reviewed?
The usefulness of a monitoring programme therefore depends on more than accuracy alone.
The frequency of the measurements, the time it takes to receive the results, site accessibility, and the way the information supports the project team all matter.
For some projects, manual settlement monitoring provides everything that is needed. In other situations, automated monitoring may offer a more practical workflow.
So how do you know which approach fits your project?
When Does Manual Settlement Monitoring Work Well?
Manual monitoring involves visiting the project site at scheduled intervals to measure settlement rods or other monitoring points.
It can be a suitable approach when:
- The number of monitoring points is limited
- Measurements are only required occasionally
- The site is easy and safe to access
- The results are not time-critical
- A surveyor already visits the site regularly
- Physical inspection is required during every round
The surveyor can collect the measurements and inspect the condition of the monitoring point and its surroundings at the same time.
The challenge is that every additional measurement requires another field visit, followed by processing, checking, interpretation, and reporting.
As the project grows or the required frequency increases, this workflow requires more capacity.
When Does Automated Monitoring Become Relevant?
Automated settlement monitoring collects measurements according to a configured schedule and transfers the data remotely for processing.
It can provide insight into:
- Daily and cumulative settlement
- Development of applied fill layers
- Horizontal and vertical displacement
- Stabilisation trends
- Unexpected movement or disturbances
Automation does not replace specialists, engineering judgement, or physical inspections.
Monitoring points still need to be installed, validated, maintained, and checked when unusual behaviour occurs. The main difference is that a new site visit is no longer required for every routine measurement.
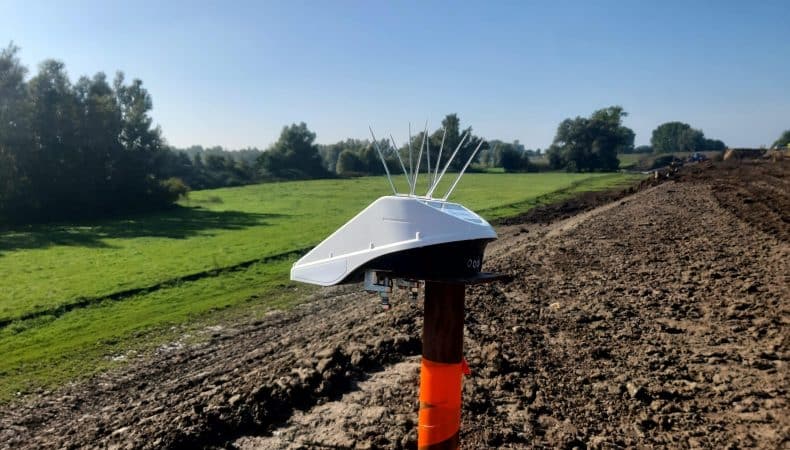
For example, during the reinforcement of the 23 km Gorinchem – Waardenburg dike, 290 Locator One units provided daily settlement measurements throughout construction. Continuous monitoring gave engineers ongoing insight into settlement behaviour and stabilisation trends, supporting construction planning while reducing the need for repeated routine site visits.
Seven Questions to Ask
1. How frequently do we need measurements?
A monthly measurement may be sufficient for periodic reporting.
When a project needs daily insight into settlement behaviour, increasing manual frequency also increases travel, field time, processing, and coordination.
Automated monitoring can provide a more consistent trend between construction activities.
2. How quickly do we need the results?
Manual observations usually need to be transferred, processed, checked, interpreted, and distributed.
That delay may be acceptable for reporting, but less practical when the project team is waiting for information before reviewing the next phase.
3. How easy is site access?
Monitoring points may be located around heavy machinery, active earthworks, soft ground, dikes, railways, roads, or restricted locations.
Automated monitoring can reduce the number of visits made solely to collect a measurement.
4. How many points do we need to monitor?
The workload of a manual programme increases with every point.
This becomes especially relevant when monitoring points are distributed across a long infrastructure corridor or several project areas.
A good example is the A27 Houten-Hooipolder widening project, where 400 Locator One units monitored settlement alongside the Merwede Bridge and a high-pressure water pipeline through a single monitoring platform. Bringing multiple assets together in one system provided consistent, ongoing insight across the entire project.

5. Does the data support planning?
Settlement information may be used before applying another fill layer, moving equipment, starting a new phase, or requesting a geotechnical review.
When project planning depends on the monitoring results, current and consistent information becomes more valuable.
During the Gorinchem–Waardenburg dike reinforcement project, daily settlement data helped engineers assess how the ground responded throughout construction. Early insight into stabilisation supported planning decisions, contributing to more efficient construction while reducing material use and CO₂ emissions.
6. Would alerts help the team?
Automated systems can flag threshold exceedances, unexpected movement, missing measurements, or possible disturbances.
An alert still requires validation and interpretation, but it can help the team identify where attention is needed.
7. What does the complete workflow cost?
The cost of manual monitoring is not limited to the field measurement.
It may also include travel, site access, processing, quality control, reporting, repeat visits, and the time spent waiting for results.
Automated monitoring includes equipment, installation, configuration, connectivity, platform use, and maintenance.
The most relevant comparison is therefore:
Which workflow gives the project the information it needs, when it needs it, with an appropriate use of time, budget, and site capacity?
It Is Not Always Either-Or
Manual monitoring is not outdated, and automated monitoring is not automatically the best solution for every project.
Some projects benefit from manual measurements. Others require automation. A combination can also be suitable, with automated monitoring providing the frequent trend and manual surveys being used for validation or specialist checks.
The right method depends on the project.
Which Monitoring Setup Fits Your Requirements?
Once automated monitoring becomes worth exploring, another question follows:
Which setup best matches your project?
That depends on factors including:
- Asset type and environment
- Monitoring duration
- Measurement frequency
- Temporary or permanent installation
- Type of movement
- Required data access
- Operational criticality
The Basetime Locator Matchmaker assesses these requirements through nine questions and provides a personalised recommendation.
You do not need to choose a product in advance. The scan helps identify the setup that best fits your answers.
You receive:
- An instant personalised recommendation
- A summary of your project requirements
- An explanation of the suggested setup
- Relevant technical information
- A downloadable report
- Suggested next steps
It takes only three to five minutes and is completely free.
Start the Locator Matchmaker: https://basetime.nl/en/the-locator-matchmaker/
Have questions about your result or want to discuss your project? Contact us at sales@basetime.nl.


